
What Happens When the Coverage Universe Stops Scaling With Headcount
In the previous post I laid out a taxonomy of the 4.2 million financial queries from our free and individual tiers that hit our API last quarter. Six categories covered 96% of the volume and five of them describe existing analyst work being compressed by AI: investment theses written faster, filings parsed in seconds, transcripts dissected on the wire. But one category did not entirely fit that pattern.
We called it 'Universe Coverage'. One in five financial queries, 78% from the buy-side. It is the only category in the dataset where the workflow itself is new, not the speed at which an old workflow is being executed. This post is about what that workflow is, why it could not exist before, and how a desk runs one in practice.
Coverage, before AI
The phrase is older than the workflow. On a traditional analyst desk, a "coverage universe" is the list of names a research function maintains an active view on. A sell-side equity analyst is hired to cover a sector, and the universe is the set of names they are paid to know in depth: typically 8 to 15 tickers, sometimes up to 25. A buy-side fundamental analyst at a long-only or hedge fund usually carries a slightly wider book, 20 to 60 names, depending on style.
The constraint that defined the universe was always labor. A useful view on a single ticker requires reading the filings, listening to the calls, tracking the consensus, monitoring the news flow, and pressure-testing the thesis when anything material changes. Done seriously, this is a full-time job for somewhere between 10 and 25 names. The bench size sets the universe size. Universes scale linearly with headcount, which is why even the largest buy-side firms cover at most a few thousand tickers across all PMs combined, and most cover well under five hundred.
What sat outside the universe was effectively dark. A long-only might track 60 names closely and treat the next 600 in the benchmark as a screen output: numerical signals, occasional touch points, no live narrative view. A PE platform might evaluate 50 acquisition candidates a year in depth, while the wider funnel of 800 to 1,200 candidates per quarter received structured scoring at best.
The long tail
Universe Coverage, as we see it in the data, is the coverage universe extended to the long tail. The same artifact the analyst produced for the inner ring (a written, cited, narrative view on a single name) is now produced for the whole list, on a recurring schedule. A typical cycle in our data spans 300+ tickers and can run at a daily, weekly, or monthly cadence with the more active books running daily.
The artifact is the same shape it has always been. A two-to-four page memo per name: thesis, recent quarter and forward guidance, competitive position, catalysts, risks, consensus, recent strategic activity. What changed is who can produce it, at what cadence, across how many tickers. The bench size no longer sets the universe size.
What people read are not the memos. What people read are the diffs. The first cycle establishes the baseline. Every subsequent cycle highlights what moved: a thesis pillar weakened, a new catalyst introduced, a risk that escalated, a consensus that drifted. The memo is the unit of production. The diff is the unit of consumption.
Why this isn't quant monitoring
The most common reaction to Universe Coverage is that it sounds like quantitative monitoring rebranded. It is not. The two workflows look superficially similar (both run wide, both run on a schedule) but they differ on every other axis.
A quant universe is monitored through numerical feeds: price action, fundamentals on refresh, statistical features, factor exposures, alternative data normalised into structured signals. The output of the monitor is a row of numbers, sometimes an alert, that flows into a model. The consumer of the output is code. In our query data, 91% of the volume from quant senders falls into the Financial Data category. The whole stack is built on structured numerical inputs producing structured numerical outputs.
Universe Coverage is the opposite shape on every variable except width.
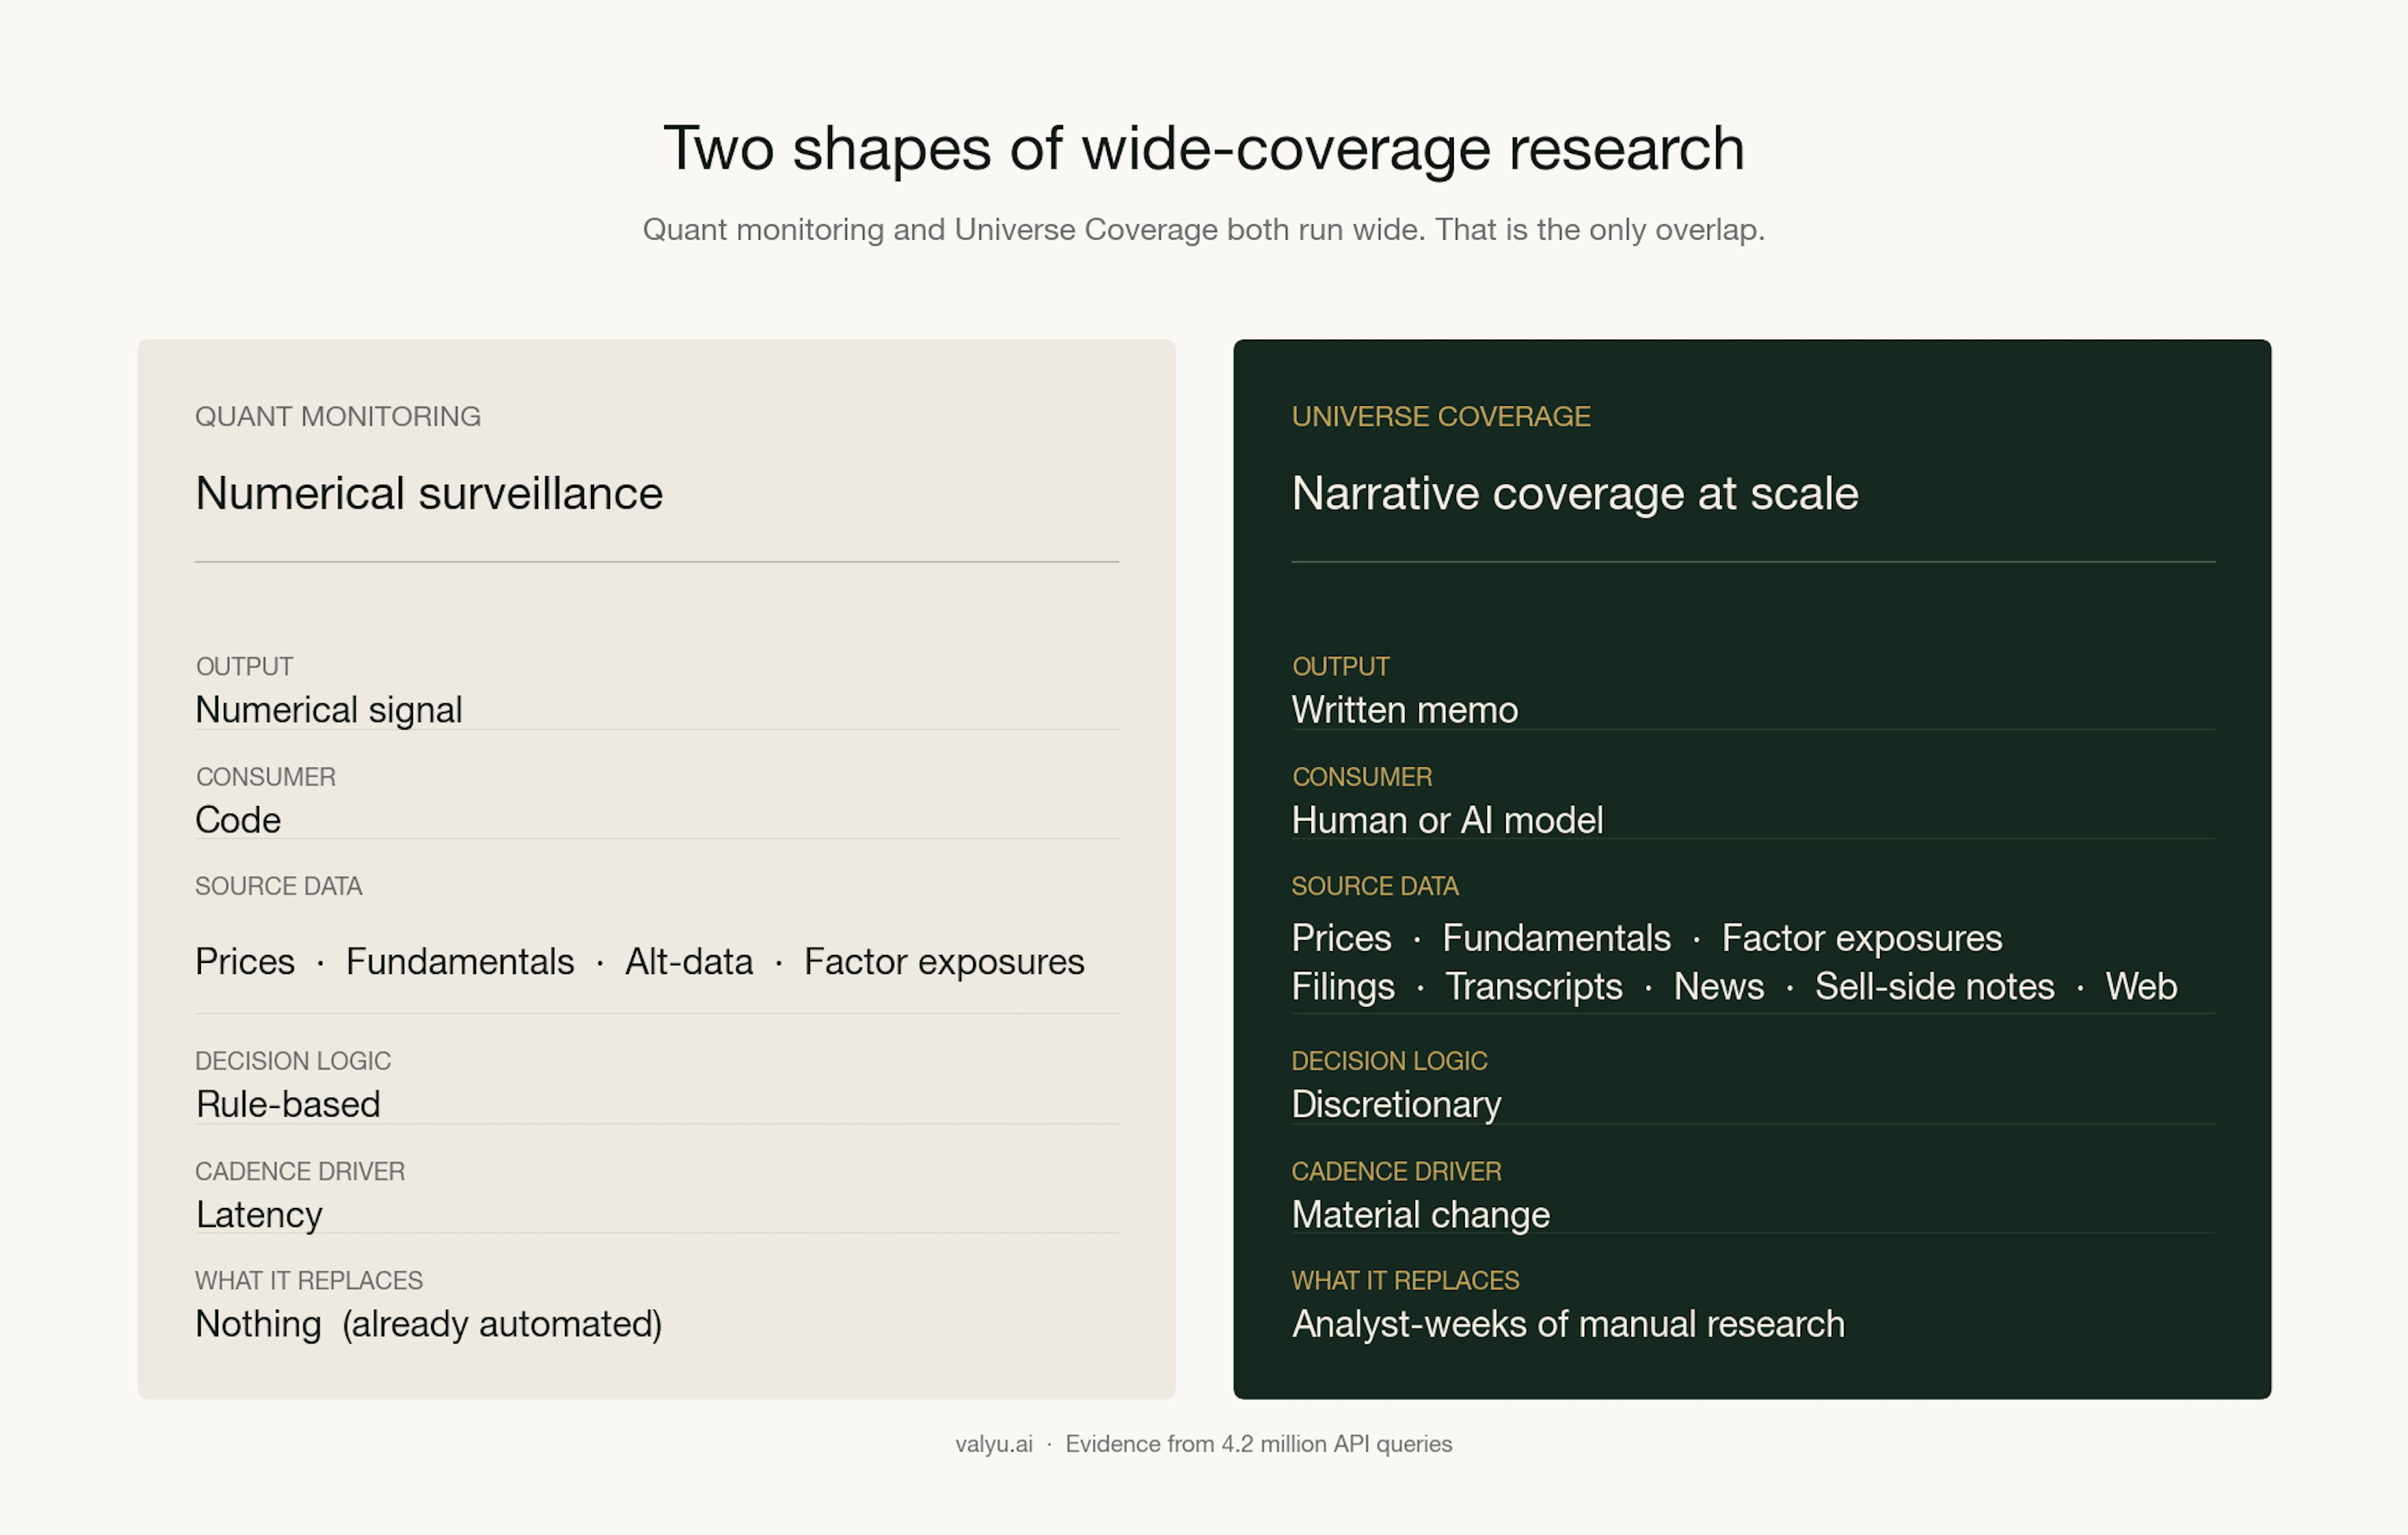
The two workflows do not compete. They sit in different parts of the firm and serve different decisions. The quant monitor exists to fire a trade rule. The Universe Coverage memo exists to maintain a defensible discretionary view.
What had to converge
Three things had to be true at the same time for this workflow to become viable, and all three only converged inside the last two years.
First, retrieval had to be live and citation-grounded because a discretionary view that cannot be defended at IC is not a view. Until AI systems had sufficient mechanisms for grounded retrieval the memo was unusable for any serious desk. Today, every credible deployment in this category sits on a RAG stack with citation as a hard constraint.
Second, the agent layer had to fan out, as a single LLM call answering "build a thesis on TICKER" produces unbounded text without structure. The systems running in production decompose the prompt into 11 to 19 sub-queries (peer comps, segment growth, margin trajectory, balance sheet, guidance delta, consensus deltas), execute them, and reassemble the answer. The agentic decomposition is what produces an output that holds up against a human one.
Third, the unit economics had to land. A complete thesis run that previously consumed 14 to 18 analyst hours now resolves in roughly 75 minutes of agent time at about $50 per run. At that price, 300 tickers a week is a $15,000 monthly line item rather than a $4 million annual headcount problem.
None of these three were stable in early 2024. All three are now table stakes.
How a cycle runs
The prompt shape we see most often is one sentence, six clauses, parameterised by ticker. Across hundreds of these workflows, the variation is small. Blank version:
Build the current investment thesis on [COMPANY NAME] ([TICKER] [EXCHANGE]
Equity). Cover the most recent quarter and forward guidance, competitive
position and market share, specific growth catalysts ([3-4 levers relevant
to the business]), key risks to the thesis ([3-4 risks relevant to the
business]), sell-side consensus and price targets, and any recent strategic
initiatives or management changes.
The two bracketed slots are where the firm encodes what actually matters for the business, in their language. The same prompt filled out for Snowflake:
Build the current investment thesis on Snowflake (SNOW US Equity). Cover
the most recent quarter and forward guidance, competitive position and
market share, specific growth catalysts (net new ARR, consumption growth,
AI workload attach, large-customer expansion), key risks to the thesis
(consumption model volatility, Databricks and hyperscaler competition,
customer concentration in top accounts, gross margin pressure), sell-side
consensus and price targets, and any recent strategic initiatives or
management changes.
To turn a prompt into a workflow takes three additional pieces: a list of tickers, a destination for the memos that preserves history (so diffs are visible across cycles), and a schedule. The first two cycles are usually noisy. By the third, the memos converge on the shape the team wants, and most of the value moves to the diff layer.
What changes
Coverage was always rate-limited by headcount. It no longer is. The constraint moves up one level, from "how many names can the team keep current" to "which names should be in the universe at all". That is a structurally easier problem.
The second-order effect is more interesting. Universes that used to be tractable only for the largest firms are now tractable for two-person teams. A family office can run a coverage footprint that previously needed a twelve-person research function. A PE platform can screen 400 acquisition candidates every week instead of every quarter. A hedge fund can hold an honest view across a wider book without rebuilding the bench.
The asymmetry the parent piece flagged sharpens here. Sell-side equity research deepens on the names it already covers. The buy-side widens into a universe the sell-side will never be paid to follow. The two postures pull in opposite directions, and the buy-side now has the cheaper tooling.
If you want to run the prompt above on the same API the buy-side is using, the platform is open at platform.valyu.ai.
More from the blog




Valyu Add
Join 12,000+ professionals and knowledge workers.
Valyu Add is a free weekly research briefing for builders, investors and operators. Every issue is sourced, cited and verified with Valyu DeepResearch.